-
Best Forex Brokers
Our top-rated Forex brokers
-
Brokers for Beginners
Start trading here
-
Islamic Account Brokers
Best accounts for Muslim traders
-
Forex Demo Accounts
Learn to trade with no risk
-
No-deposit Bonuses
Live trading with no deposit
-
KES Trading Accounts
Save on conversion fees
-
ECN Brokers
Trade with Direct Market Access
-
Lowest Spread Brokers
Raw spreads & low commissions
-
Market Maker Brokers
Fixed spreads & instant execution
-
MetaTrader 4 Brokers
The top MT4 brokers in Kenya
-
MetaTrader 5 Brokers
The top MT5 brokers in Kenya
-
TradingView Brokers
The top TradingView brokers
-
cTrader Brokers
The top cTrader brokers in Kenya
-
All Trading Platforms
Find a platform that works for you
-
Copytrading Brokers
Copy professional traders
-
Forex Trading Apps
Trade on the go from your phone


Last Updated On Feb 26, 2021

Despite the EURUSD being the most traded and liquid currency pair, it has a relatively short history. The Euro was officially introduced as an electronic currency on January 1st, 1999, and only later in 2002, it started to circulate as paper currency.
At first, only twelve EU nations adopted the Euro as their national currency, but now it is adopted by 19 of the 28 European Union member states. Historically, Europe was one world’s largest trading blocks, but that trade was complicated by fragmented currencies which led to the introduction of the common currency.
The introduction of the European currency is considered to be the most significant monetary reforms in modern history. The initial EURUSD exchange rate was 1.1795, but by the time it started circulating as paper money in 2002, the EURUSD exchange rate fell to 0.8907. The highest level reached by the EURUSD exchange rate was 1.6037 in July 2008, before the subprime mortgage crisis that would follow.
Nowadays, the Euro is considered to be the second largest reserve currency in the world after the USD. The USD alone makes up 85% of the total FX trading volume, while the EURUSD currency pair accounts for roughly 30% of the Forex turnover.
EURUSD Trends and Technical Analysis
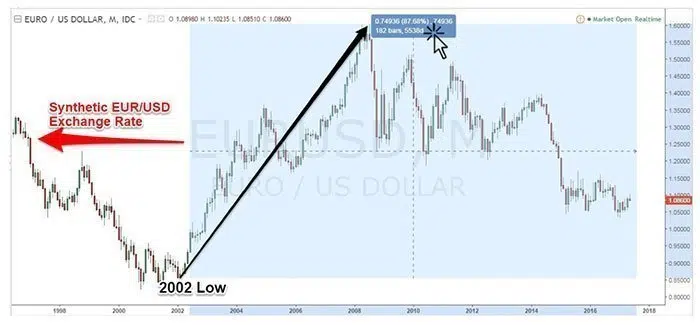
EUR/USD Monthly Chart
Since its introduction EUR/USD has been moving in a secular bullish trend that culminated with EURUSD almost doubling in value (87.68%) and reaching the all-time high at 1.6037.
These significant trends have strong fundamental drivers that put them in motion. On the one hand, we have the US Federal Reserve. The US Federal Reserve is seen as the world’s central bank, an acknowledgement of the dollar’s status of being the world’s reserve currency. On the other side, we have the ECB, which drives the Euro monetary policy.
The EURUSD has had strong trends (bullish and bearish trends) that were only interrupted by short periods of consolidations. As a trading tip and a general rule, each period of consolidation is the starting point of either a new trend or a continuation of a previous trend.
How to identify a trend
The simplest method to use to identify a trend is to watch for the price to make higher highs followed by higher lows which would indicate a bullish trend. Lower lows followed by lower highs would present a bearish trend.
A better visual way to identify the trend is to use a simple moving average like the 200EMA which is regarded as the most accurate moving average. Typically, if we trade above the 200EMA, we’re in an uptrend, and conversely, if we trade below 200EMA, we’re in a bearish trend.
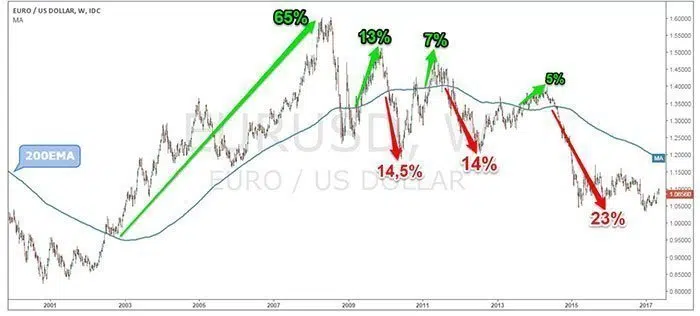
EUR/USD Weekly Chart
EURUSD Trading Tips
When it comes to trading, there are three ingredients for a perfect trade, but ideally, we would like to look for as many critical factors in our favour as possible. The three elements you should incorporate into your trading decision are:
- Fundamentals;
- Technicals;
- Sentiment;
The fundamental backdrop for the EUR/USD is what is driving the volatility as well as the trading opportunities. The technicals can help us in timing the market, while sentiment can help us determine how the other market participants are positioned in the market.
Best time to trade the EURUSD
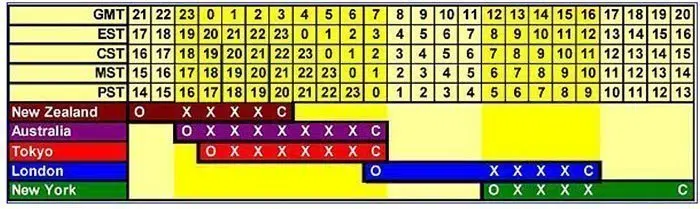
The best time to trade the EUR/USD is when the London session overlaps the New York session between 8:00 AM – 12:00 PM EST. Usually, this is the time the majority of all FX transactions happen, and consequently, the market is prone to make significant fluctuations, and thus it makes an excellent opportunity to make a profit.
Knowing when not to, can be as important as knowing when to trade. The EUR/USD becomes less tradable during the Asia session as the majority of trading activity is chasing away.
Trade during the London and New York session open:
The big financial centre openings, like the London session opening and New York session opening, can be a source of great trading opportunities. Usually, the FX dealers execute big orders during the first minutes of the open, which is why we see volatility suddenly increasing during that time.
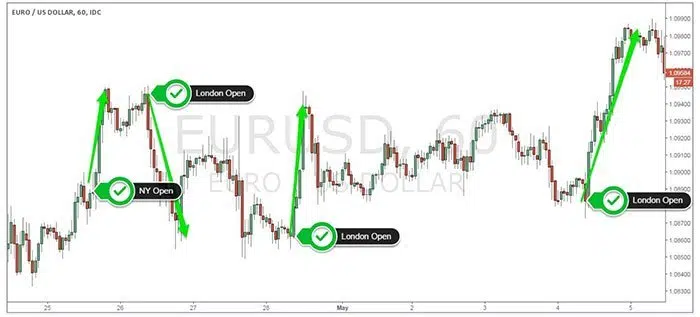
EUR/USD 1H Chart
Using seasonal patterns
The EUR/USD seasonal pattern is a great way to establish market bias. The markets are governed by cycles, and this should be an extra factor to consider before pulling the trigger on a trade. This seasonal pattern will only show the EUR/USD tendencies to rise or fall at a certain point in time.
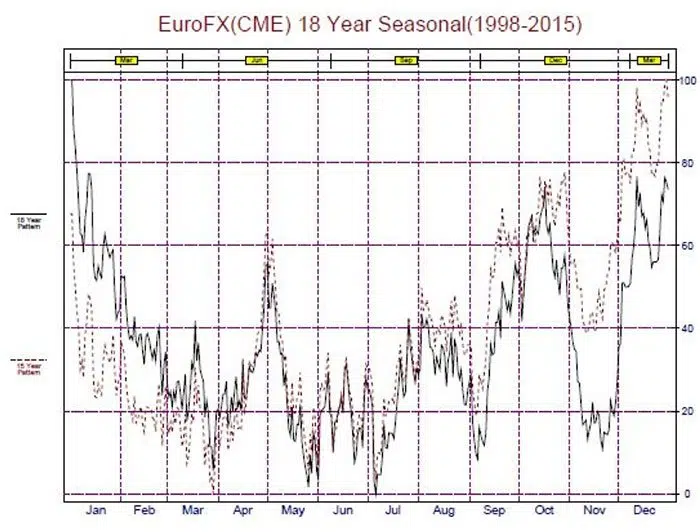
EUR/USD Seasonal Cycle
We can note that EUR/USD tends to top in May and October while it tends to find a bottom in July, September, and November. This alone is a great deal of information as it can keep us on the right side of the market.