-
Best Forex Brokers
Our top-rated Forex brokers
-
Brokers for Beginners
Start trading here
-
Islamic Account Brokers
Best accounts for Muslim traders
-
Forex Demo Accounts
Learn to trade with no risk
-
No-deposit Bonuses
Live trading with no deposit
-
KES Trading Accounts
Save on conversion fees
-
ECN Brokers
Trade with Direct Market Access
-
Lowest Spread Brokers
Raw spreads & low commissions
-
Market Maker Brokers
Fixed spreads & instant execution
-
MetaTrader 4 Brokers
The top MT4 brokers in Kenya
-
MetaTrader 5 Brokers
The top MT5 brokers in Kenya
-
TradingView Brokers
The top TradingView brokers
-
cTrader Brokers
The top cTrader brokers in Kenya
-
All Trading Platforms
Find a platform that works for you
-
Copytrading Brokers
Copy professional traders
-
Forex Trading Apps
Trade on the go from your phone


Last Updated On Jun 13, 2024

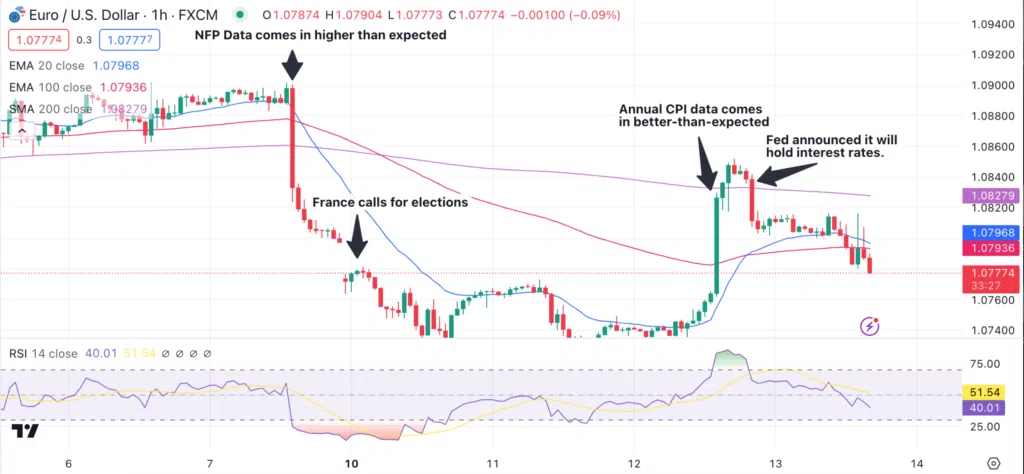
It’s been a wild week in the markets. After weeks of relatively low volatility, Friday’s NFP release kicked off a rollercoaster ride for traders. As the EUR/USD is the most heavily traded pair, we’ll be focussing on it for this article, but you could really pick from any of the major pairs.
NFP Blowout: The big drop
The EUR had been in the ascendency in recent weeks, even the ECB’s decision to lower interest rates last week did little to change that narrative. That all changed on Friday as the NFP came in blisteringly hot, with the market expectation of 185k blown out of the water by a read of 272k. Indicators in recent weeks had lent some support to the idea that the US economy was (finally) cooling off. But this destroyed that paradigm in remarkable fashion, with the EUR/USD plummeting from 1.09 to 1.08 by market close on Friday evening.
EU Elections and Macron’s Gamble: The slide continues
At this point, politics got involved—as it often does. Despite the mainstream media’s narrative of the far-right’s ascendancy, the EU parliamentary elections were actually very good for centrist parties across the bloc. Yes, the far-right made gains in some countries, most notably France and Austria, but the loose centrist coalition of EPP, SD, and Renew retained a majority in the EU parliament, which will allow the EU projects of expansion and tighter federation to continue.
But it seems the French did not get the memo. Immediately following his party’s heavy defeat in the EU elections, France’s centrist President, Emmanuel Macron, decided to call the French electorate’s bluff and announced snap national elections. This is a huge gamble and could backfire spectacularly.
France and Macron’s importance to the EU project cannot be overstated, and a far-right, Eurosceptic government in Paris could cause untold damage.
Traders – and Macron’s political allies – were nonplussed by his gambit, forcing the EUR/USD lower as concerns over political instability filtered through the markets. The result was a rare event in the forex markets as the EUR/USD gapped lower on Monday morning. The EUR/USD finally bottomed out on Tuesday afternoon around 1.0720.
CPI: And back up the other side
After a brief lull, the rollercoaster ride continued yesterday, Wednesday 12 June. US Annual CPI which measures headline and core inflation for the year, came in under market expectations. Headline print was 3.3% vs 3.4% expected and core came in at 3.4% vs 3.5% expected. It was not a huge change, but it was enough for futures traders to once again pin their hopes on an (almost mythical at this point) September rate cut. EUR bulls were waiting in the wings for the moment and the EUR/USD shot back up over 1.0850.
Revenge of the dot plot: And down again…
But the euro’s bull run was more of a light jog. Immediately following the better-than-expected inflation figures the Federal Reserve announced that they were going to keep interest rates on hold this month, as expected. What wasn’t expected was the infamous “dot plot” showing that they expect only one cut to rates this year – all but cancelling the notion of a September rate cut and sending the EUR/USD back into freefall.
Monthly CPI: Stop I want to get off
Things have settled down a bit today, but the US CPI figures for May showed a significant monthly cool-down in inflation in the US – continuing the theme from yesterday’s annual CPI. While the EUR/USD initially spiked on the news, it has now subsided back to range around 1.0800 – it seems that even traders are growing weary of the ride.
The overall picture is that unless things drastically change over the summer, the Fed will keep rates at their current level until November. As much as investors (and Joe Biden) would like a rate cut in September, it is very unlikely now, and pressure will remain on the EUR/USD throughout the summer.
Technical Analysis
On the daily chart, the EUR/USD hovers just below the 1.0800 level—a strong support and resistance level reinforced by the 200-day SMA. Having hit a weekly high of 1.0850 yesterday after better-than-expected US Annual CPI data, the pair again resumed its slump and looks poised for further downside moves.
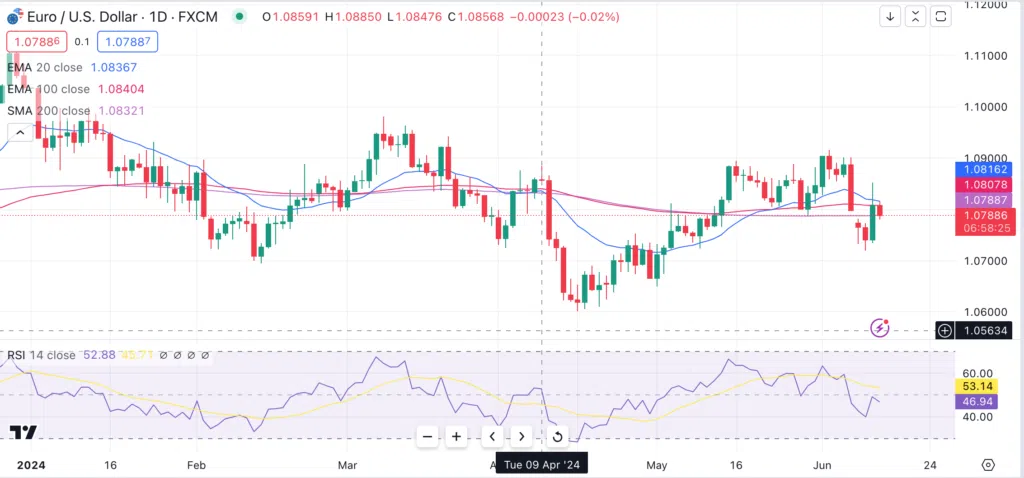
On the hourly chart, this is confirmed by the 200-hour SMA riding high above price, seemingly gaining traction, in addition to directionless 20-hour and 50-hour EMAs. The RSI sits below 50 at 42, which suggests that further downside moves could be on the cards.
On the downside, immediate support will be experienced at 1.0745 (this week’s low) and below that at 1.0710. On the upside, 1.0840 is the immediate level to watch and beyond that, 1.0885.